Do you use PowerPoint presentations to describe relationships in your data? Then you can use SmartArt graphics to produce eye-catching, visual representations of such information. SmartArt graphics contain placeholders where you can add text and photos that will make our data stand out instead of using plain text. In our Learn PowerPoint series, we’ll learn how to use SmartArt graphics to convey various relationship and concepts.
Types of Concepts You Can Explain with SmartArt Graphics
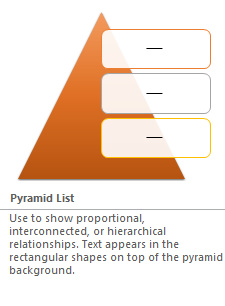
Lists
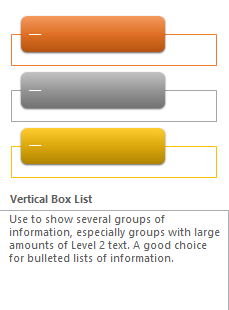
SmartArt Graphics allow you to visually represent lists of information. For example, a list of items needed for building a project plan, including pictures if necessary.
Process
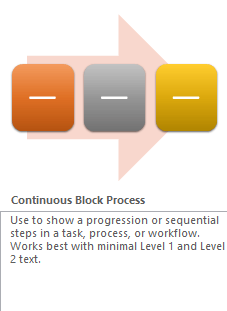
If you have a set of ordered steps to complete a job, you can use the SmartArt graphics related to Process category to visually display the information. For example, the process to build a coffee table.
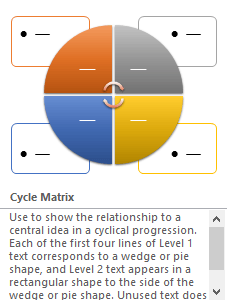
Cycle
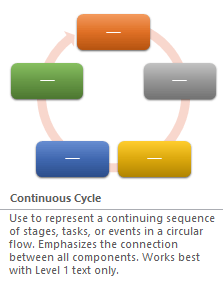
If you want to represent a circular sequence of steps that are needed for a central idea, this can also be visually represented via SmartArt graphics. For example, the looping process for quality testing a product.
Hierarchy
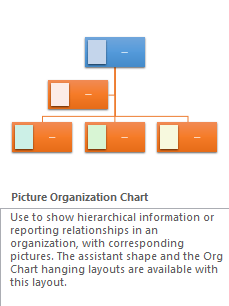
If you want to showcase the structure of an organization, such as the top level management of your startup or company, you can use Hierarchical SmartArt graphics.
Relationship
If you want to show relationships between elements visually, again SmartArt graphics is the way to go. For example, if you want to highlight how a software helps in improving productivity between different groups of people, you can use relationship models to showcase it.
Matrix
If you want to depict the relationship of components to a whole using diagrams, Matrix SmartArt graphics are the best options. For example, the contributions of the different teams in a department.
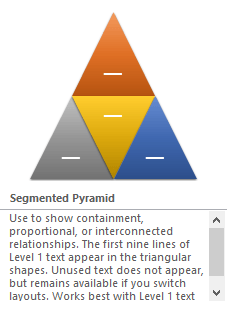
Pyramid
To illustrate proportional or interconnected relationships Pyramid SmartArt graphics are recommended. For example, displaying the amount of time that should be spent on different phases of a project.
How to Use SmartArt Graphics in a Presentation
When creating a SmartArt diagram in PowerPoint, you first select a layout. Next, you start populating data in a pop-out window called the Text pane. The biggest advantage with using SmartArt graphics in PowerPoint is that you can also convert an existing bulleted list directly to a SmartArt diagram.
The SmartArt graphic layout usually displays generic colors but when applied to your slides, they take up the theme colors of the presentation. You can also change the colors to other options of your choice. SmartArt graphic layouts are not mutually exclusive. Some of them can be used to display multiple types of data as well, such as a process or list.
PowerPoint 2016 offers around 200 SmartArt templates. To insert a SmartArt graphic, here’s what you need to do:
1. Open up your PowerPoint presentation. Navigate to the slide where you want to want to add the SmartArt.
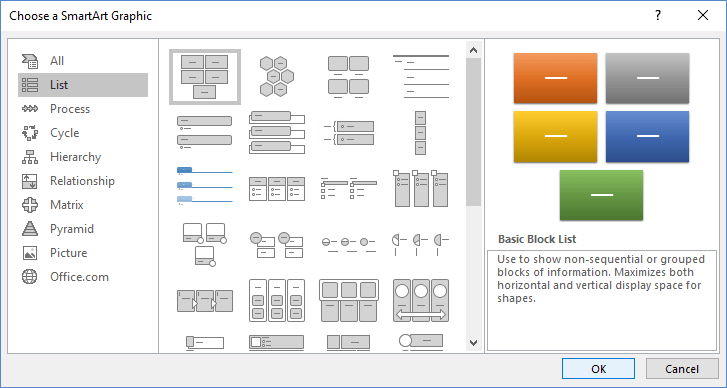
2. Select the Insert tab. On the Illustrations group, click SmartArt. This will open up the Choose a SmartArt Graphic dialog box. On the left pane of the dialog, you have different conceptual categories. The middle pane displays the SmartArt graphic layouts available in the category. The right pane shows you how this diagram will look like in color. It will also give a brief description of the SmartArt and what it is best used for.
3 . Select a SmartArt of your choice and click OK.
4. After you choose a layout, PowerPoint inserts the diagram on the slide and opens up the Text pane containing placeholders. The placeholders adapt themselves to the text you enter as sometimes it can be more, and other times it can be less. If, at first, you don’t see the text pane, you can click the Arrow button at the side of the SmartArt layout to activate it.
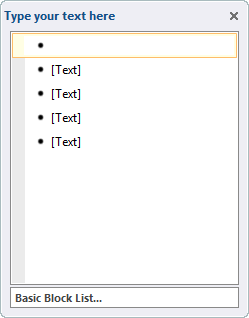
You can insert and modify the text in the SmartArt in one of two ways; either directly in the diagram shape or in the respective Text pane. If you don’t want to use the Text pane, you can click the arrow on the SmartArt layout to hide it.
TIP : For a more neat look, avoid using punctuation at the end of the text.
![]()
The Text pane can display a single-level bulleted list, or a multilevel list if the diagram layout supports it. You can also expand the diagram by adding more list items or by adding more shapes.
If you do decide to add more entries, the shape of the SmartArt will change to to accommodate the extra content. If text entries are too long, the font size will become uniformly smaller to accommodate the shape size.
After you add a SmartArt graphic layout and add the text to it, you can move, resize and format it to achieve professional-looking results.
How To Convert Bulleted Lists to a SmartArt
Sometimes, you may not want to create a SmartArt diagram from scratch. If you already have an old presentation with plenty of bullet lists that you want to make more interesting, you can simply convert them to a SmartArt diagram in a few clicks. Here’s how to do it.
1. Click inside the placeholder that holds the bullet points you want to convert.
2. Then, right-click in the selected placeholder and choose Convert to SmartArt. This will display a small SmartArt gallery. Hover you mouse pointer over each thumbnail to see a live preview of what your bulleted list will look like if you applied that SmartArt.
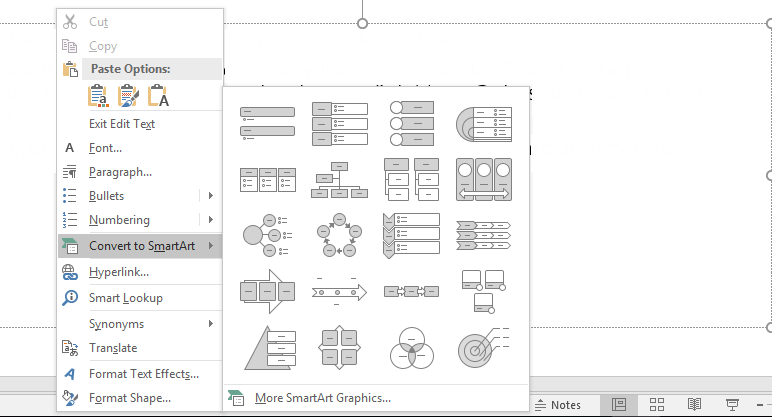
3. If the SmartArt graphics available in that gallery don’t match your needs, click More SmartArt Graphics. This will display the Choose a SmartArt Graphic dialog box. Here you can choose a layout of your choice. Once you have selected the design, click OK.
How to Edit and Format SmartArt Graphics
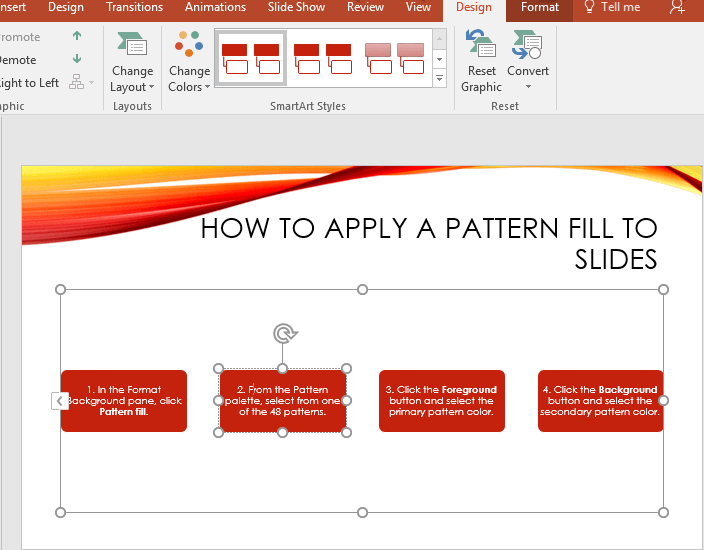
If the SmartArt graphic layout you originally selected doesn’t fit your content as well as you’d like it to, you can easily change it to a different layout. When you click a SmartArt graphic, the contextual Design SmartArt Tools Tab and the Format SmartArt Tools Tab on the ribbon is displayed.
If you want to make any changes to your SmartArt, you can use the commands in these tabs to make the change. The Design tool tab lets you:
- Add, move, and change the hierarchy of shapes.
- Change to a different layout.
- Change the color scheme of the diagram.
- Change the effects applied to the diagram shapes.
- Reset the diagram to its default settings.
How To Change the Layout of a SmartArt Graphic
To change the layout of a SmartArt graphic:
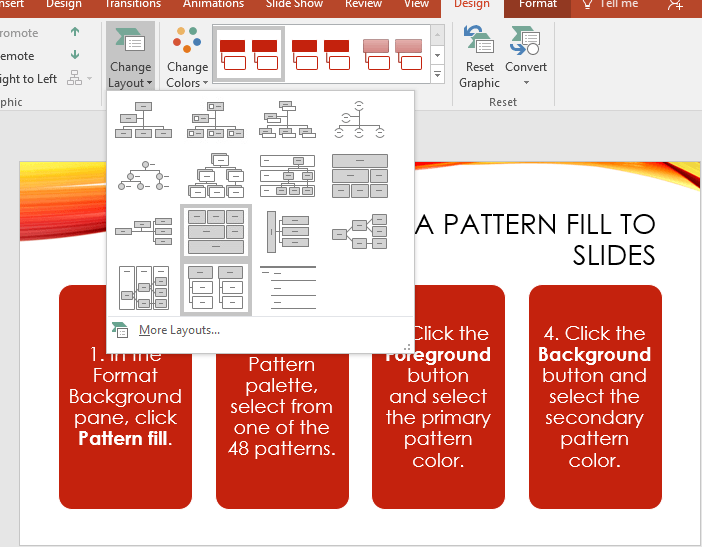
1. Select the SmartArt.
2. On the Design tab, in the Layouts group, click the More button to view the Layouts gallery. The gallery displays only the available diagram layouts for the currently selected diagram layout category.
3. Click another SmartArt graphic to change the layout. If you don’t like any of the options in the gallery, click More Layouts. This will display the Choose A SmartArt Graphic dialog box, from where you can choose another layout.
How to Add a Shape to a SmartArt Graphic and Remove It
1. Select the SmartArt.
2. Open the Text pane. At the end of a list item, press Enter to add an item to the list and a shape to the diagram. You can also select the Design tab, and in the Create Graphic group, click the Add Shape button.
3. To remove a shape from a SmartArt, select it and press the Delete key. You can also select the item from the Text pane and press the Delete key.
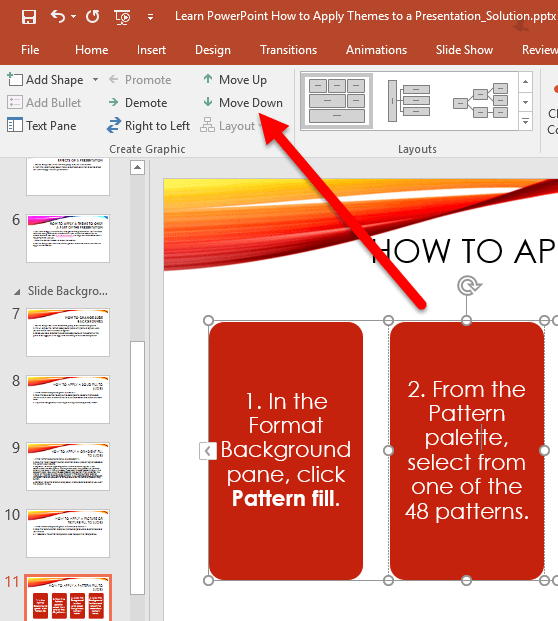
How to Move a Shape in a SmartArt Graphic
You can move shapes only in SmartArt layouts that support multiple levels of content.To move a shape in a SmartArt graphic:
1. Select the shape that you want to move.
2. On the Design tab, in the Create Graphic group, click the Move Up or Move Down button to change the order of the list. Alternatively, you can also select the item in the Text pane, cut and copy it to a different location in the list.
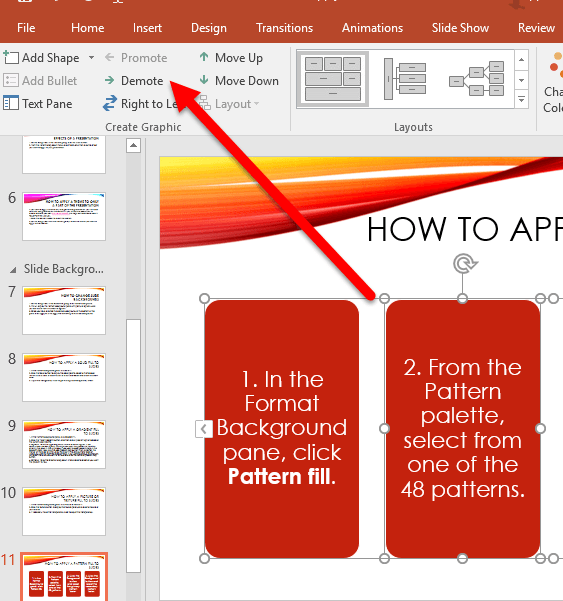
How to Change the Hierarchy of Shapes in a SmartArt Graphic
You can promote and demote shapes only in SmartArt layouts that support multiple levels of content.
1. Select the shape that you want to promote or demote.
2. On the Design tab, in the Create Graphic group, click the Promote or Demote button to change the hierarchy level of the shape and update the list in the Text pane.
How to Format SmartArt Graphics
You can format the shapes and lines in a SmartArt graphic as well as the text within the shapes using the Format tab.
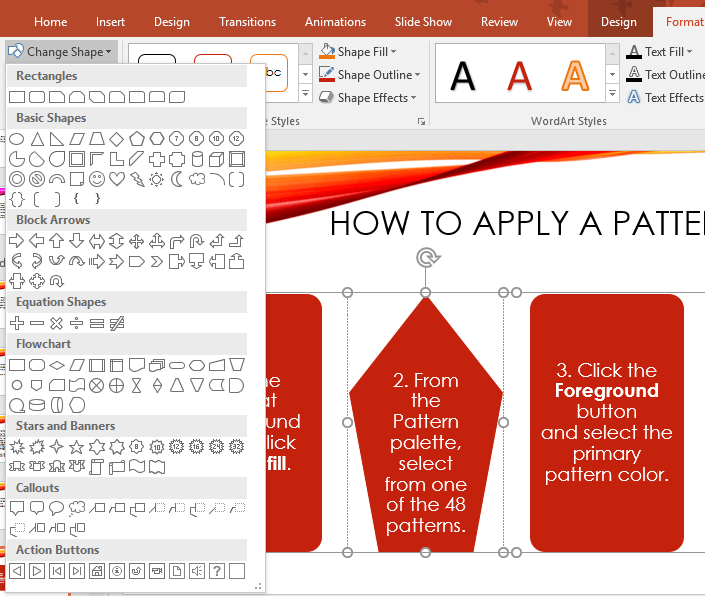
One of the ways in which you can format the shape of a SmartArt graphic is by placing emphasis on a particular step in the process. You could for instance, change the shape of that step into a circle or rectangle to show it apart from the rest. You can also apply a different fill, colors, and effects to the shape. To format the shape of a SmartArt graphic:
1. Select the shape you want to format.
2. Select the Format tab. In the Shapes group, click Change Shape. The Shapes gallery will open up and you can choose a desired shape from the list.
3. If necessary, in the Shape Styles group, you can choose to add a different fill color, shape outline, and shape effect.
4. One other thing you can do is apply WordArt text effects to the text in a shape. To do this, select the text you want to apply the style to. In the WordArt Styles gallery, select a text style. Again, you also have options to add a different text fill, text outline, and text effects.
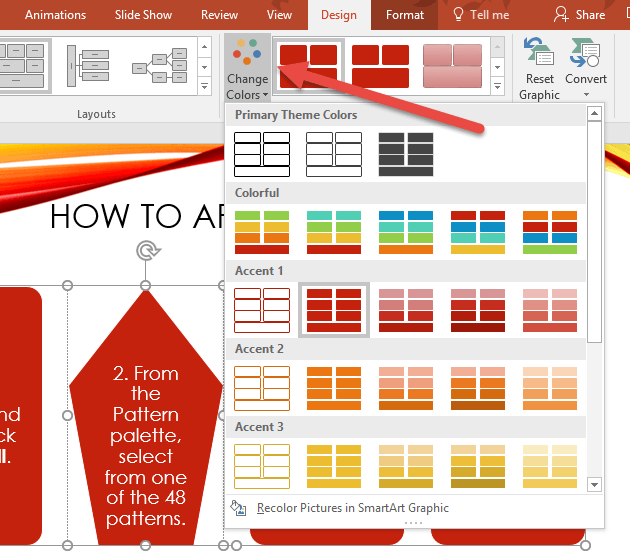
How to Change the Color Scheme of a SmartArt Graphic
1. On the Design tab, in the SmartArt Styles group, click the Change Colors button. This will open up color gallery. The options available in this gallery are based on the color scheme of your presentation.
2. You can hover over a color option in that gallery to see a live preview of that option. Once you’ve selected a color, click it to apply it to the SmartArt.
How to Change the Colors or Visual Effects of Shapes in a SmartArt Graphic
1. Select the shapes you want to format.
2. On the Format tab, in the Shape Styles group, do any of the following:
- Click Shape Fill. From the menu, select the color, picture, gradient, or texture to fill inside the shape.
- Click Shape Outline. From the menu, select the color, weight, and form for the shape outline.
- Click Shape Effects. From the menu, click an effect and then select the visual effect for the shape.
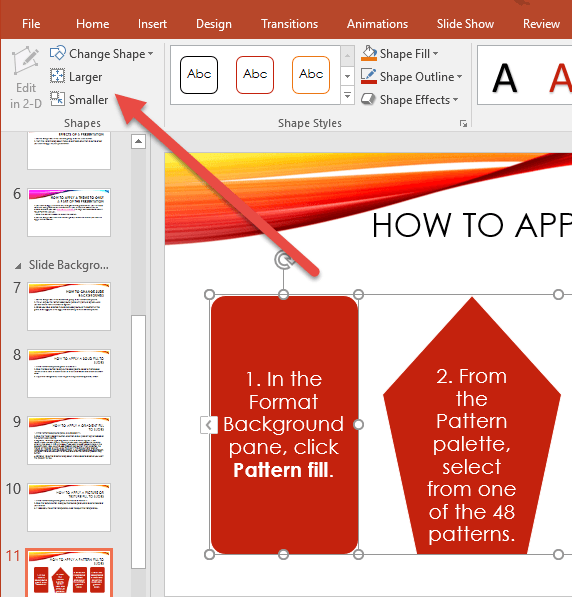
How to Change the Size of Individual Shapes in a SmartArt Graphic
1. Select one or more individual shapes, and then do any of the following:
- On the Format tool tab, in the Shapes group, click Larger or Smaller. These commands will be active only when you select the entire SmartArt graphic.
- Drag the sizing handles of any shape to change the height and width of the shape. Or, on the Format tool tab, in the Size group, set the Height and Width.
Finally, if at any time, you want to go back to the original SmartArt graphic you can reset it to its default formatting.
How to Reset a SmartArt Graphic to its Default Formatting
1. Select the SmartArt graphic.
2. On the Design tab, in the Reset group, click the Reset Graphic button.
One point to note though, is that you can use the Reset Graphic command only to reset the entire SmartArt graphic, not to reset the individual shapes.
That’s pretty much the long and short of using SmartArt graphics. If you want to test your grasp on the subject, click the link below to download the practice files and perform some simple tasks set out in the TXT file.
Download the Practice Files for Working with SmartArt Graphics
Leave a Reply